Book a Demo





Many banks already run some form of funds transfer pricing (FTP). Each loan and deposit carries an internal rate that records what the money behind it costs the institution, and treasury or the asset and liability management (ALM) function charges and credits the business areas on that basis. FTP is often read as a technical treasury exercise, an internal rate that changes little in how other areas are run.
Having an FTP rate, however, is a different thing from steering the bank with it. Where an institution has no dedicated FTP engine, the calculation typically runs by hand in spreadsheets, on simplified curves and simplified assumptions. The figure it produces reaches management as a report and rarely changes a price, a commercial priority or a target.
This article examines why FTP built this way stays a report: what the surveys say about adoption and use, where a manual process loses the real margin, and what a calculation needs before its margin can steer the bank.
Adoption Is Wide, Steering Lags Behind
The surveys that exist agree on adoption. In a Roland Berger survey of German EBA banks published in April 2017, 85% of participants had implemented a liquidity transfer pricing system, with internal charging by Treasury or ALM.
Use tells a different story. In a survey published in the Scandinavian Journal of Management in September 2018, Viktor Elliot gathered 99 responses from 28 of Sweden's 31 savings banks. He found FTP widely implemented but unsophisticated. Having the rate did not mean steering with it.
The mechanics point the same way. The Bank for International Settlements (BIS) Financial Stability Institute, surveying liquidity transfer pricing at 38 large banks in nine countries, found that many relied on manual, offline processes to update their transfer prices. BCG's 2026 Treasury Benchmarking Survey, which does not look at FTP specifically, found many institutions still relying on manual processes and fragmented data.
None of these sources measures how many banks calculate FTP in spreadsheets, and the two FTP surveys are dated or national in scope. Read together, they still describe one pattern: wide adoption, with use for steering well behind it.
The Rate Cycle Made the Gap Visible
When central banks raised rates sharply in 2022 and 2023, net interest income climbed across most of the industry. McKinsey's Global Banking Annual Review 2024 attributes most of the improvement in industry profitability since 2021 to wider net interest margins, and estimates that without that tailwind, return on tangible equity in many geographies would have been around 8%, near or below the cost of capital. The figure is an estimate for the industry, not for any single bank.
Many institutions could not easily say how much of their rising income was contribution margin and how much was the rate effect. The line between the two runs through the FTP rate of every contract. Where that rate was approximate, so was the answer. Whichever way rates move next, management needs to know what stays profitable once the rate effect is taken out.
The Mistake Is Missing Measurement, Not Poor Execution
It is tempting to read a weak FTP as a problem of execution, one that a better-run version of the same process would fix. Slow runs and manual files are real problems, although they are symptoms. Álvaro Nieto, Head of Product at Mirai, locates the failure one level deeper:
The mistake I see in clients is not that they execute badly. It is that they have no measurement tools to decide where to sell, at what price, and what to incentivize or disincentivize.
The distinction matters because of what FTP is supposed to measure. As what funds transfer pricing really measures shows, the FTP rate is a base rate taken from the yield curve plus a set of FTP spreads that each institution defines for itself; a liquidity spread, an optionality spread and a regulatory spread are one example of such a set. The rate the bank applies minus the FTP rate is the contribution margin. Leave out any component, and the bank reports a margin it does not earn.
A mortgage shows how quickly the error compounds. A bank that does not charge its mortgages the regulatory cost of granting them, nor account for how each new mortgage affects its ratios, can end up granting a very high volume of them that turns out to be negative for it. The price looks adequate because the missing cost never reaches it, and the more the product sells, the larger the loss.
The same blind spot shapes where the bank grows. An average funding rate charges a 30-year mortgage what it charges a one-year loan, so the liquidity spread for money tied up for three decades drops out without anyone deciding to drop it. Branches rich in stable deposits look weak, branches lending heavily on underpriced mortgages look strong, and management adds targets and resources to the wrong one, a distortion traced in which branches really earn.
A bank steers by the margin it measures, whether that margin is real or not.
How Can Banks Measure the Real Margin Behind Every Loan and Deposit?
What a Manual FTP Process Looks Like
Nieto's description of the manual process is short:
A manual process carries too many assumptions. It is not fine-grained, it relies on simple methods, simple models and very basic simplifications, and it takes a long time.
In practice, a spreadsheet FTP carries four limits, each of which blurs the margin on its own:
- simplified curves, approximations standing in for the real yield curves behind each base rate and liquidity spread
- simplified assumptions, many of them, applied through simple methods and models rather than market-standard methodologies
- a coarse breakdown, with the margin calculated on averages and portfolios rather than contract by contract
- a long run time, slow to produce and slower to repeat when a curve or an assumption changes
Together they deliver a number that is approximate, averaged and late. That is enough to describe last quarter, and not enough to change next quarter's pricing.
Contractual Terms Where Customer Behavior Should Be
The simplifications that matter most sit inside the assumptions, where nobody sees them. The liquidity spread should follow how long the money is really tied up, which often differs from what the contract says. A current account can be withdrawn tomorrow, yet much of the balance stays for years, which is why, as a 2024 Forvis Mazars article on loan pricing notes, non-maturity deposits need decay studies before an FTP rate can be assigned.
The assumption behind that study moves the margin directly. Practitioner guidance such as Moorad Choudhry's Bank Internal Funds Transfer Pricing Best-practice (January 2018) describes banks assigning very different behavioral terms to similar current account products, and the same deposits would show a very different contribution margin under each.
The optionality spread depends on behavior in the same way. A 30-year fixed-rate mortgage rarely runs to its contractual term, because customers prepay or refinance. Pricing that choice from the contractual term understates what the option costs the bank.
Curves and Grids Left to Go Stale
Curves age as fast as assumptions do. Choudhry describes curves and pricing grids left to go stale, and recommends reviewing grids at least quarterly. Some failures are older still: in 2015 the Bank of England's Quarterly Bulletin reported that a Prudential Regulation Authority (PRA) cross-firm review had found some major UK banks failing to differentiate transfer prices between loans and deposits of different maturities. That flattens exactly the signal the liquidity spread is meant to send.
Under stable conditions, a slow and dated calculation is an inconvenience. Curves drift rather than jump, and last month's FTP rates are close enough to this month's for most decisions.
In more volatile periods, curves can move more in a week than in a quiet quarter. A margin that arrives days late describes a balance sheet that has already changed, and the corrected figure reaches management after the pricing decision it should have informed. The delay becomes the error.
Why a Simplified Model Cannot Steer
A simplified model can still tell the bank, after the fact, roughly what its funding cost was on average. It cannot tell a product manager which loans to stop writing, or a regional head which branches kept their margin once rates turned. Nieto puts the limit plainly:
With spreadsheets it is very hard to run a real FTP, with real assumptions, real yield curves and market-standard methodologies. What you get is a simplified model that doesn't hold up in a real use case.
Incentives follow the measurement. The BIS Financial Stability Institute survey found bonus pools that were often a simple percentage of accrued revenue, calculated with no regard for the liquidity risk the business had taken. Targets set on volume push growth; targets set on contribution margin push profitable growth. A spreadsheet FTP that arrives late and on averages cannot carry the second kind of target, so the first kind stays in place.
An FTP of this kind remains a report rather than a management tool.
What a Real FTP Calculation Needs
A real FTP calculates the base rate and each FTP spread for every contract in the book, rather than for a product category or an average balance. It does so on the bank's real yield curves, with real assumptions about how customers use their contracts, and with market-standard FTP methodologies such as weighted average life, repricing term or Macaulay duration. These are examples only: each institution defines its own FTP spreads and chooses the methodologies that fit its products.
Calculated this way, the contribution margin exists at the finest level of detail the bank holds. The margin by product, business area, region, branch or manager becomes an analysis of that one figure rather than a separate estimate rebuilt for each committee. When a branch's margin moves, the bank can see which contracts moved it and which component of the FTP rate explains the change.
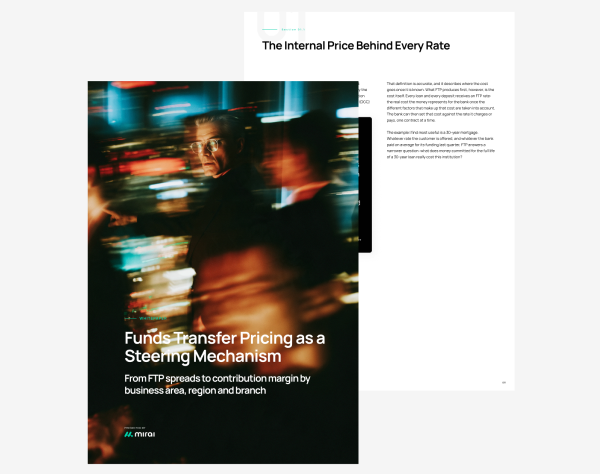
At that scale, the calculation works only as a fully automated process, from the bank's source systems to its operational systems, with no manual step. In Nieto's experience, automation takes it from hours, and in some cases days, to minutes. The whitepaper Funds Transfer Pricing as a Steering Mechanism sets out what a real FTP calculation needs instead and how it runs without manual steps.
Institutions that measure the real margin contract by contract can decide where to sell, at what price and what to reward before the results come in. Those that keep FTP in spreadsheets will keep reading last quarter's margin while pricing next quarter's business.
The Mirai Platform is one example of this approach, bringing FTP, balance sheet management and regulatory compliance together on one data load and one set of assumptions.
For the full framework, from the base rate and FTP spreads to contribution margin by product, area and branch, calculated overnight and tested with what-if strategies, see Mirai RiskTech's whitepaper Funds Transfer Pricing as a Steering Mechanism: how banks measure and steer the real margin.